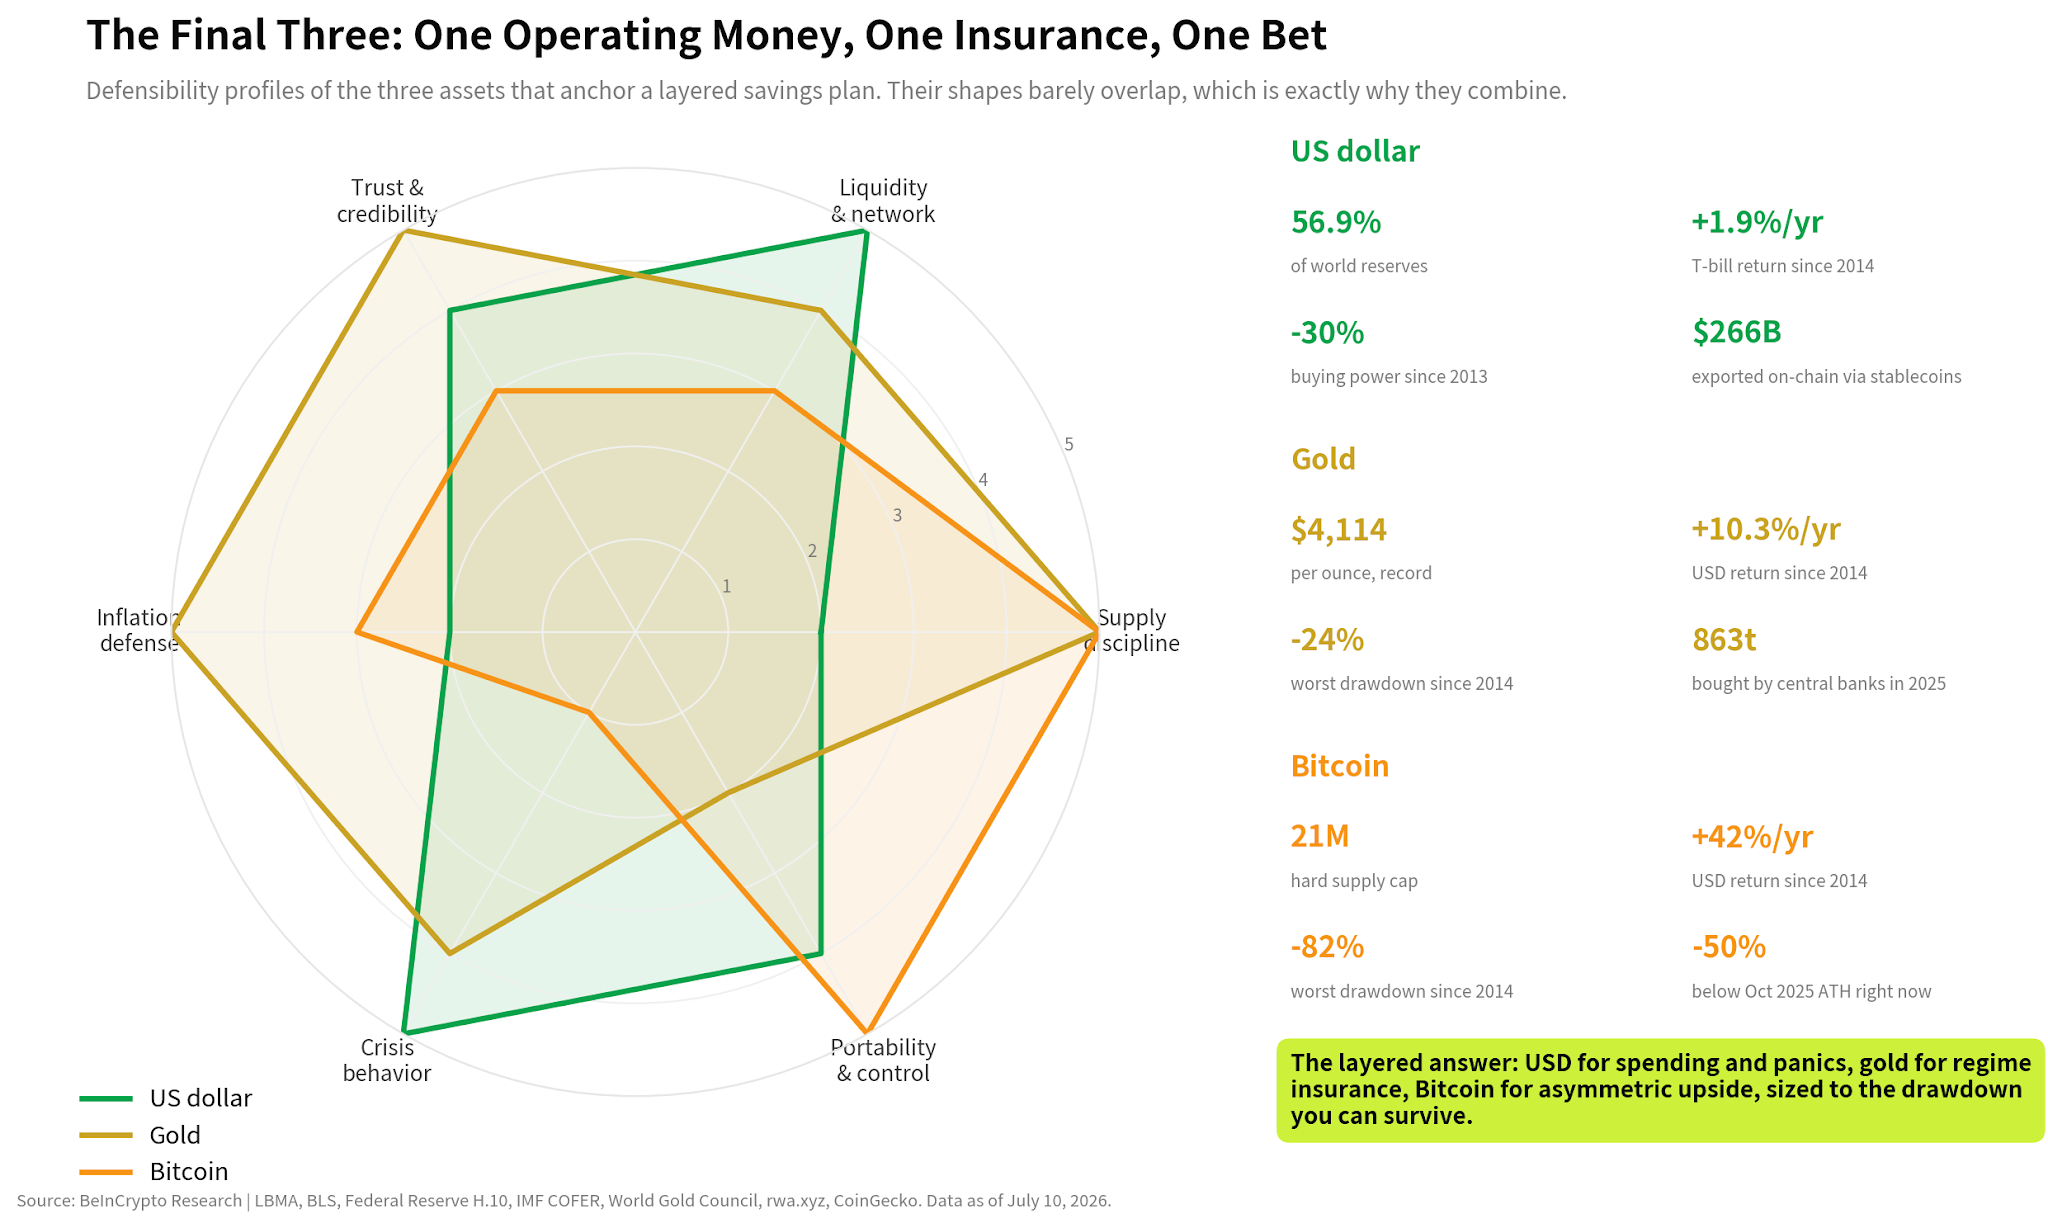
There is no single best currency for every kind of saving. Our research found three assets with three different jobs: the US dollar for liquidity, gold for long-term insurance, and Bitcoin for high-risk upside.
The Swiss franc was the strongest government-issued currency in the study. Yet even the franc failed to beat US inflation in most long holding periods. Gold protected purchasing power more often, while Bitcoin produced far higher returns over its much shorter history and charged investors with repeated crashes.
The main lesson is simple. A saver first needs to decide what the money must do. Cash for next month’s bills has a different job from wealth meant to last for decades.
What “Best Currency” Means in This Study
People often use currency, cash, and savings as if they mean the same thing. They do not.
In this study, “money” includes seven government-issued currencies, gold, and Bitcoin. The seven currencies are the US dollar, euro, British pound, Swiss franc, Singapore dollar, Japanese yen, and Chinese yuan.
Gold and Bitcoin are not everyday currencies for most people. We included them because savers use both as alternatives to government money and because neither has a central issuer that can create more supply at will.
The research judged each form of money by four practical questions. Did it hold its value over time? Could a saver sell or use it during a crisis? How severe were the losses along the way? Could an owner move and control it without depending entirely on one institution?
This produces a broader answer than a simple exchange-rate table. A currency can be stable and still lose purchasing power. An asset can deliver a large return and still be unsuitable for emergency savings.
How the Research Was Conducted
We ran three return tests and then built a seven-part scorecard. All figures use data available through July 10, 2026. The charts draw on BeInCrypto Research calculations using the London Bullion Market Association, US Bureau of Labor Statistics, Federal Reserve H.10 exchange-rate series, IMF reserve data, World Gold Council, RWA.xyz, and CoinGecko. Individual claims link to supporting sources in the text.
Test 1: What Happened to $100 from 1971?
The first test starts in 1971, when the United States ended the dollar’s convertibility into gold. That change marked the beginning of the modern system of freely floating government-issued currencies.
We asked what happened if a saver converted $100 into each available form of money in 1971 and held it until the study’s cutoff date. We then translated the final value back into US dollars.
Alongside those returns, we plotted an inflation line using the US Consumer Price Index. It shows how much $100 had to become to buy the same broad basket of goods and services. By July 2026, the answer was about $815.
The test measures the money itself. It excludes bank interest, bond yield, gold storage costs, trading fees, taxes, and other income or expenses. A dollar, therefore, remains a nominal $100 throughout the chart, even though its buying power falls.
This choice matters. A saver who held Treasury bills or an interest-paying account would have done better than someone holding banknotes. The same principle applies to interest earned on deposits in other currencies.

Test 2: A common starting point in 2013
Four of the nine assets could not take the full 1971 test. Bitcoin and the euro did not exist. The Chinese yuan was not freely tradable, and comparable Singapore dollar data starts later.
We therefore repeated the exercise from the end of 2013. This gave all nine assets the same starting date and allowed Bitcoin to complete at least one full 10-year holding period.
In this test, $100 needed to become $144 to match US inflation. Bitcoin reached $8,381 and gold reached $342.
The Swiss franc finished at $110 and was the only fiat currency to beat the dollar, although it still missed the inflation target.

Test 3: Rolling five-year and 10-year periods
A single start date can flatter or punish an asset. Someone who bought gold near its 1980 peak had a very different experience from someone who bought it in 2001.
To reduce that start-date problem, we tested every available five-year and 10-year holding period in annual steps. A 10-year window beginning in 1971 was one observation. The next began in 1972, then 1973, and so on.
For each window, we asked a yes-or-no question: did the money rise faster than US inflation? The final percentage is the share of windows in which it succeeded.
Bitcoin beat inflation in all four of its available 10-year windows. That perfect result comes from a short and favourable sample. Gold succeeded in 59% of 10-year windows. The Swiss franc managed 22%, the yen 24%, and the pound and dollar cash recorded 0%.
The Seven-Part Scorecard
Returns tell only part of the story. We also scored each asset from 1, or weak, to 5, or strong, across seven traits: supply discipline, market liquidity, trust, inflation protection, behaviour during crises, portability, and price stability.
The scores combine market data with editorial judgement. They are a framework for comparing different risks, rather than a price forecast or a promise of future performance.
The Swiss franc earned the highest raw score at 30 out of 35. Gold followed at 28. The US dollar and Singapore dollar scored 27.
However, the total alone does not decide the final choice. Two assets can earn similar scores while doing the same job. A useful combination needs assets whose strengths cover different weaknesses.

The Cost of Volatility
We compared annualised US-dollar returns with each asset’s worst peak-to-trough fall from 2014 to July 2026. A peak-to-trough fall, or drawdown, measures how far an asset dropped before it began to recover.
For this chart, short-term US Treasury bills act as a realistic low-risk dollar cash proxy. That is different from the zero-interest cash assumption in the long-run currency tests, and the chart labels the change.
The result shows the trade-off clearly. Assets with small price falls generally produced low returns. Bitcoin produced the largest return and the deepest loss.

The Three Assets that Survived the Test
The final three did not finish first in every category. They survived because each solves a different savings problem.
1. US Dollar: The Operating Money
The dollar remains the world’s main reserve currency. Central banks hold it, companies borrow in it, and a large share of global trade is priced or settled through it.
It accounted for 56.9% of disclosed foreign-exchange reserves at the study’s cutoff date. That network creates constant demand and gives dollar markets unmatched depth.
This is especially important during a panic. Borrowers and investors often need dollars to repay debts or meet urgent obligations, so demand can rise even when the crisis began in the United States.
For a saver, this makes the dollar easy to buy, sell, transfer, and spend in many countries. It also makes dollar cash or short-term US government debt useful for emergency liquidity.

The Dollar’s Weakness is Purchasing Power
The same dollar that worked well during crises performed badly as a 55-year store of value. It stayed at $100 in nominal terms while the inflation hurdle rose to $815.
Since 2013 alone, dollar cash lost about 30% of its US purchasing power. Interest can offset part of that loss, but the result depends on the rate paid and the tax charged on the interest.
The dollar’s global share has also declined. It represented about 71% of disclosed reserves in 1999, compared with 56.9% in the study.
The decline has been gradual. No single rival currency has replaced it. Central banks have spread part of their reserves into gold and smaller currencies.

Debt and Sanctions Add Longer-Term Risk
US federal debt stood near 120% of annual economic output. Higher debt does not automatically cause a currency crisis, but it can limit policy choices and increase pressure to tolerate inflation.
The freezing of about $300 billion of Russian central-bank reserves after the invasion of Ukraine revealed another risk. Dollar assets held through banks and custodians can be blocked by governments.
That lesson matters most to states and sanctioned entities, but it also explains why some central banks have increased their gold holdings. Gold held directly does not depend on another country’s payment system.
Digital Finance is Extending the Dollar’s Reach
Stablecoins and tokenised US Treasury products have carried the dollar onto blockchain networks. At the cutoff date, the market included hundreds of billions of dollars in dollar-backed stablecoins and about $15 billion in tokenised Treasuries.
These products add new settlement routes. They still depend on dollar assets and therefore extend the dollar system rather than replace it.

Verdict: The dollar remains the strongest choice for liquidity and near-term obligations. Cash alone is a weak long-term inflation hedge.
2. Gold: The Long-Term Insurance
Gold produced the strongest 55-year result. The notional $100 investment grew to $9,436, far above the $815 inflation line.
Its advantage is simple. No government issues gold, and no central bank can create more of it with a policy decision. It also has a long global market and no issuing government that can default.
Gold therefore protects against a different risk from dollar cash. It can benefit when investors lose confidence in currencies, public debt, or financial institutions.

Gold Did Not Protect Savers All the Time
The long-run return hides long periods of disappointment. Gold beat US inflation in 59% of rolling 10-year windows, which means it failed in about four out of ten.
Its worst 10-year period lost about 8.3% a year after inflation. A buyer near the 1980 peak then waited roughly two decades for a durable recovery.
By contrast, gold’s most recent 10-year period returned about 10% a year after inflation. It was the strongest rolling decade since 2011.

The Current Rise is Broad, Not Only a Dollar Story
Gold reached records in dollars, euros, pounds, yen, and yuan. When the same asset rises against several major currencies, the move reflects concern about government money more broadly.
That pattern is one reason we describe gold as insurance. It can respond to risks that affect several countries at once.

Central banks bought 863 tonnes of gold in 2025. It was the fourth consecutive year of unusually strong official demand.
Those purchases do not guarantee further price gains. They do show that national reserve managers increasingly use gold alongside government bonds.

Storage is Gold’s Main Practical Weakness
Physical gold is heavy, costly to secure, and difficult to move in large amounts. Gold held through a fund or bank is easier to trade, but the saver then depends on a custodian.
Governments have also restricted private ownership in the past. The United States sharply limited private monetary-gold ownership from 1933 until the 1970s.
Verdict: Gold has the strongest long-term record and can insure against broad loss of confidence in government money. It can still fall sharply and remain weak for many years.
3. Bitcoin: The High-Risk Upside
Bitcoin produced the largest return in the common 2013 test. A notional $100 became $8,381 by July 2026, compared with $342 for gold and an inflation target of $144.
Its supply rules cap the total at 21 million coins. An owner can also hold Bitcoin directly without relying on a bank, although doing so safely requires technical care.
Those features address two weaknesses of government money: supply can expand, and intermediaries can block access. They help explain why some investors treat Bitcoin as a digital alternative to gold.

The Short History Flatters the Result
Bitcoin beat inflation in every available 10-year window. There were only four such windows, all beginning during the asset’s early growth period.
Gold, the franc, the yen, and the pound have decades of data across several inflation and interest-rate cycles. Bitcoin does not. Its result should therefore carry a large confidence discount.
A Saver Had to Survive Repeated Crashes
Bitcoin fell about 82% from its 2013 peak to the 2015 low. It fell 77% during the 2022 bear market and was around 50% below its October 2025 record of $126,080 at the study’s cutoff date.
These losses are too large for money that may be needed at short notice. A saver forced to sell during a downturn may never receive the long-term return shown in the chart.

Bitcoin also lost value against gold during the latest decline. One Bitcoin bought about 35 ounces of gold at the end of 2024 and around 15 ounces by July 2026.
This comparison matters because a rise in dollar terms does not always mean an asset is preserving value against other scarce assets.

Bitcoin Has Behaved Like a Risk Asset in Panics
Bitcoin fell sharply during the March 2020 market panic. It also received the lowest crisis-behaviour score in our framework because investors often sell it when they urgently need cash.
That does not remove its long-term case. It limits its usefulness as an emergency reserve.
Verdict: Bitcoin offers the strongest upside and the clearest defence against supply dilution. Its short history and extreme drawdowns make it unsuitable for money a saver cannot afford to lose or leave untouched.
Why the Other Currencies Did Not Make the Final Three
Several fiat currencies performed better than the dollar on individual measures. None added a sufficiently different role to the final combination.
Swiss Franc: The Strongest Fiat Currency
The Swiss franc turned $100 in 1971 into $486 and $100 in 2013 into $110. It was the only fiat currency to beat the dollar in the common 2013 test.
Switzerland has a long record of low inflation and strong institutions. Its currency often gains when investors become nervous.
However, the franc still beat US inflation in only 22% of rolling 10-year periods. It also comes from a small market, which limits its ability to absorb global savings at the scale of the dollar.
Policy can create sudden moves. In January 2015, the Swiss National Bank ended its exchange-rate floor against the euro without warning, and the franc rose as much as 30% within minutes.

Verdict: A high-quality fiat reserve for savers who can access it efficiently. It improves the cash layer but does not replace gold’s inflation role or Bitcoin’s upside.
Singapore Dollar: a Strong Regional Currency
The Singapore dollar finished the 2013 test at $98. That was close to its starting value and much stronger than the euro, pound, yen, or yuan.
The Monetary Authority of Singapore manages the currency against a basket within a policy band. The system has produced stability, but the exchange rate remains a policy choice shaped partly by the needs of an export economy.
The market is also small. The Singapore dollar does not appear as a separate major category in the IMF’s global reserve data.

Verdict: A disciplined regional store of value. Its size and managed exchange rate limit its role as a global savings anchor.
Euro: Deep Markets, Weaker Returns
The euro is the clear second-largest reserve currency, with 20.3% of disclosed reserves. Its markets are large, liquid, and widely accessible.
Yet $100 converted into euros at the end of 2013 was worth $83 in July 2026. It lost value against the dollar and remained far below the $144 inflation target.
The euro also combines one central bank with 20 national governments and bond markets. During a crisis, investors can question whether the weakest member will receive enough support from the rest.

Verdict: Useful for spending and saving in the euro area. The research found no evidence that euro cash offers stronger long-term inflation protection than the dollar.
British Pound: a Liquid Currency in Long Decline
The pound remains a major traded currency and one of the world’s larger reserve holdings. London gives it deep financial markets.
Its long-run savings result was the weakest in the 1971 test. The original $100 fell to $53 in dollar terms, and sterling beat US inflation in none of the 46 rolling 10-year windows.
The decline included sudden crises. Sterling came under severe pressure during the 1976 IMF rescue, the 1992 exit from Europe’s exchange-rate mechanism, and the 2022 UK budget shock.

Verdict: Highly usable and liquid, especially for UK expenses. Its historical record does not support it as a superior long-term store of value.
Japanese Yen: A Haven that Weakened after 2020
The yen nearly doubled against the dollar over the full 55-year test, turning $100 into $194. For much of that period, investors treated it as Asia’s main safe-haven currency.
The recent result was very different. The yen lost roughly 36% against the dollar from 2020 to July 2026 and finished the 2013 test at $65.
Japan’s government debt is more than twice the size of annual economic output, while the Bank of Japan owns close to half of the government bond market. Raising interest rates enough to support the yen can therefore increase pressure on public finances.

Verdict: Still a large and liquid currency, but its recent policy constraints weaken the case for long-term savings.
Chinese Yuan: Scale with Limits on Access
China has the world’s second-largest economy, and about 30% of its own trade was settled in yuan at the study’s cutoff date.
Global reserve managers remain cautious. The yuan accounted for only 1.9% of disclosed reserves, and $100 converted at the end of 2013 was worth $89 in July 2026.
The main problem is control. China restricts how money moves across its borders. A saver may therefore face rules that limit when or how funds can leave the country.

Verdict: Increasingly useful for trade connected to China. Capital controls make it a poor general-purpose global savings currency.
What the Findings Mean for an Ordinary Saver
The first priority is matching the currency to the expense. Someone who pays rent and food bills in euros needs enough euros for those bills. Holding the entire emergency fund in dollars would add exchange-rate risk at the moment the money is needed.
After near-term expenses are covered, the study supports a layered approach. Dollar assets can provide global liquidity. Gold can protect against long-term monetary and political risk. Bitcoin can add a high-risk return source for money that can remain invested through a severe fall.
The research does not identify a universal percentage for each asset. The right mix depends on the saver’s home currency, time horizon, legal access, custody options, and ability to withstand losses.
Before choosing a savings currency, a reader should ask:
- When will I need the money? Near-term funds need stability and easy access.
- What currency will I spend it in? Matching future expenses reduces exchange-rate risk.
- How large a temporary loss can I tolerate? Bitcoin and gold can fall when the money is needed.
- Who controls access? Bank accounts, funds, physical gold, and self-custodied Bitcoin carry different custody risks.
The Swiss franc and Singapore dollar can strengthen a fiat savings layer for people with affordable access to them. They remain government-issued currencies and overlap with the dollar’s main role.
The evidence therefore points to three distinct functions. The dollar handles liquidity. Gold provides insurance against a wider loss of confidence in government money. Bitcoin supplies possible upside with a risk level that requires strict limits.
Final Summary
The 55-year test found no asset that was safe, liquid, inflation-resistant, portable, and calm at the same time. Every strength carried a cost.
Gold delivered the strongest long-run protection but failed through long stretches. The dollar stayed liquid in crises while losing buying power. Bitcoin led returns over its short record and suffered losses many savers could not tolerate.
For most readers, the practical answer is based on roles. Match near-term cash to the bills and keep liquid reserves for emergencies. Treat gold as long-term insurance. Bitcoin belongs only in money that can withstand a deep drawdown.
The post What is the Best Currency to Save In? A 55-Year Test Shows Three Options appeared first on BeInCrypto.