
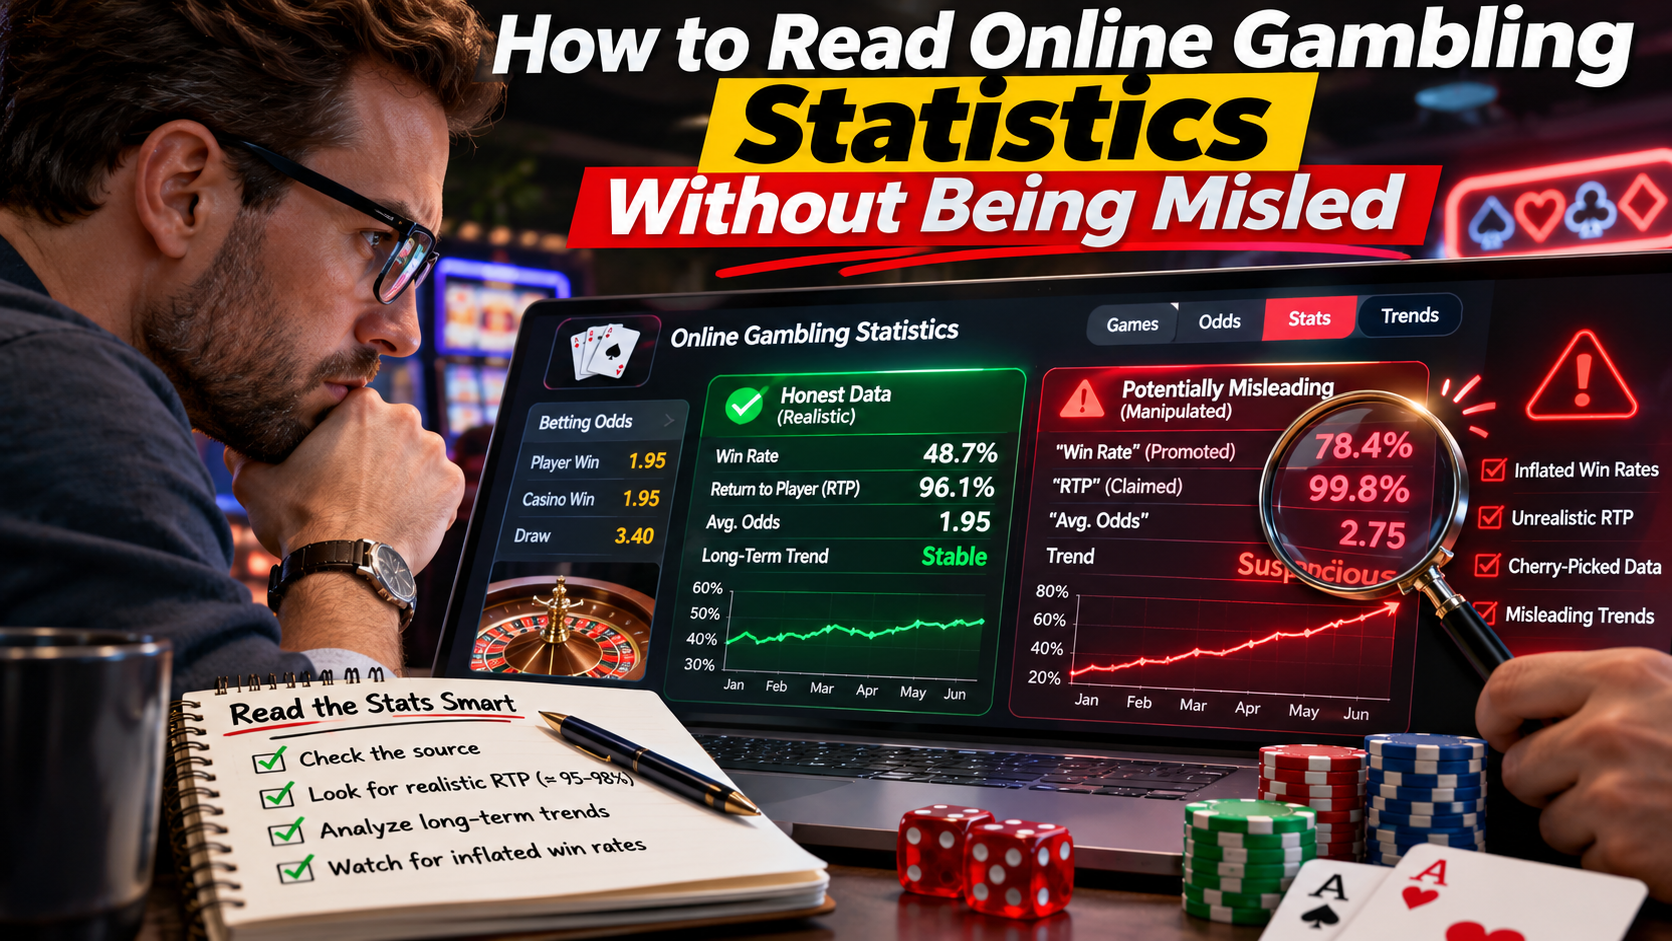
Online gambling is full of numbers: market sizes, growth rates, counts of casinos, shares of licences, average RTPs, percentages of players using a payment method. Many of them are repeated across hundreds of articles without anyone checking where they came from. This guide explains how gambling statistics are usually produced, the most common ways they mislead and the questions worth asking before you reuse one.
Ask what is being counted
The same market can be described very differently depending on the unit. Revenue figures count money. Brand counts count casino websites. Operator counts count companies, and one company can run dozens of brands. Player counts count accounts, and one person can hold accounts at many casinos.
A good example is licensing. If you measure by revenue, the large regulated markets such as Great Britain dominate. If you measure by brand, internationally licensed casinos dominate instead. In one 2026 count of 11,457 online casinos, Curaçao was listed by 3,249 casinos, more than the Malta Gaming Authority (1,343) and the UK Gambling Commission (1,269) combined. Both views are correct; they answer different questions.
Ask what the denominator is
Percentages are only as good as the group they are calculated from. “40% of casinos” can mean 40% of all casinos, 40% of casinos with data on that topic or 40% of casinos in a specific market. In the licence count above, Curaçao’s share is 39.8% of casinos that list any licence, not of all casinos. Similarly, a figure such as “53% of casinos accept crypto” means something different depending on whether casinos without payment data are included. A reliable statistic states its denominator.
Ask how missing data is handled
Missing data is one of the biggest traps. If no licence was found for a casino, that is a gap in the information, not proof that the casino is unlicensed. Studies that treat missing data as a negative finding exaggerate problems; studies that silently drop missing records exaggerate coverage. The honest approach is to report missing data as its own category, for example “no licence information found for 27.2%”.
Ask when the data was collected
Gambling markets change fast. Licences are granted and revoked, new brands launch every week and regulators change the rules. A statistic without a date is impossible to interpret. Prefer figures that state a snapshot date or a collection period, and be cautious with figures copied from articles that are several years old.
Ask whether the source can be checked
Many widely quoted market figures come from paid research reports whose methods are not public. That does not make them wrong, but it does make them impossible to verify. Figures backed by public primary sources, such as regulator registers, official market statistics or open datasets with downloadable files, can be checked by anyone. When an article gives a number, look for a link to the dataset or report behind it, not just to another article that repeats it.
Be careful with averages
Averages hide distributions. An “average RTP of 96%” across slots says nothing about the spread between games, nor about the fact that many games are offered in several RTP versions, so the same title can return different percentages at different casinos. An average withdrawal time can be pulled up by a few extreme cases. Where possible, look for medians, ranges or full distributions.
Separate claims from verified facts
A lot of gambling data consists of claims: what casinos say about themselves in their footers and terms, or what review sites say about casinos. Claims are useful, but they are not the same as facts confirmed at the primary source. Good datasets label which values come from primary registers and which are claims gathered from other sources, and they show when sources disagree.
Watch out for circular sourcing
Statistics often travel in circles: article A cites article B, which cites a press release, which cites article A. If you follow the chain and never reach an original dataset, the number may have no real basis. Some figures in this field have been repeated for years after the underlying study was withdrawn or updated.
A checklist for any gambling statistic
- What is being counted: money, brands, operators, players or games?
- What is the denominator?
- How is missing data reported?
- When was the data collected?
- Can the original data be downloaded or checked?
- Is the figure an average, and if so, what does the distribution look like?
- Are claims separated from verified facts?
Where open data helps
Openly licensed datasets make these questions easier to answer, because anyone can download the files and recalculate the figures. The licence figures quoted in this article come from a dataset of online casino facts published under CC BY 4.0, with charts and CSV files for licensing, country access, payments, games and player protection (source). Whatever dataset you use, citing it with a date and a link lets readers check the number for themselves.
Summary
A gambling statistic is only meaningful when you know what it counts, what it is a share of, how missing data was treated, when it was collected and where it came from. Asking those five questions before repeating a number is the simplest way to avoid spreading figures that do not hold up.